Why Do Variable Wind Speed Readings Occur with a Constant Wind?
por Jacob Davis | Actualizado: 01/31/2018 | Comentarios: 4
At some point, you may have watched the real-time wind readings from your data logger and seen the wind speed bouncing back and forth. Then, you probably wondered if it really was that gusty outside. In many cases, what you are seeing is the resolution of the pulse measurement. In this article, I’ll explain the accuracy and resolution of a pulse measurement, and how resolution affects your real-time readings.
What is the resolution of a pulse measurement?
Note: The resolution of a pulse measurement is the same for all Campbell Scientific data loggers.
A pulse measurement is a digital measurement, and its resolution is dominated by time. The resolution is one pulse per interval. For a real-time value, the resolution is 1 divided by your scan rate.
When the actual signal frequency is between steps in the resolution, a constant input will result in real-time readings that bounce by a resolution step. If those values are averaged over a longer interval, the new resolution is 1 divided by the averaging interval.
The graph below shows how a constant 0.5 Hz signal appears to oscillate when read on a one-second scan rate. The one-minute average of those readings, shown as the blue line in the graph below, correctly results in 0.5 Hz.
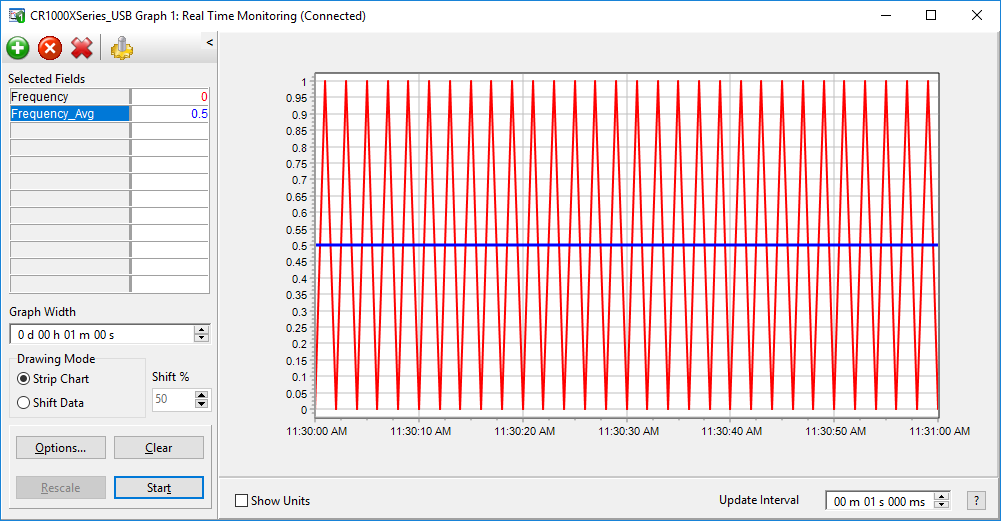
Click the graph for a larger image.
Moving the frequency up or down within the resolution step creates a sawtooth wave. The graph below shows how a 0.25 Hz signal would appear, read by the same data logger.
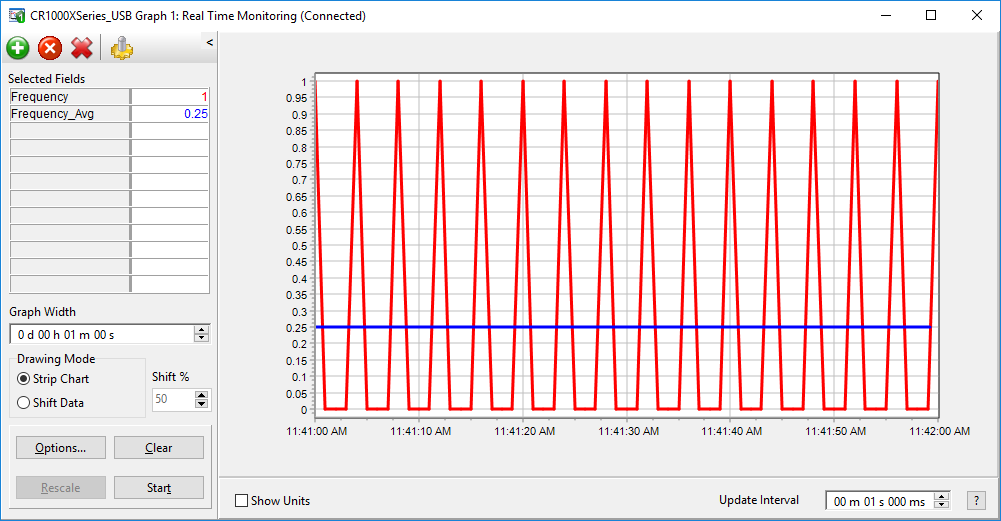
Click the graph for a larger image.
A 200.25 Hz signal would oscillate in the same manner, except between 200 and 201.
The table below shows an example of the resolution for three different scan rates, and how a 4.5 Hz signal would appear in real time:
| Scan Rate | Resolution | Lowest Value Seen | Highest Value Seen |
|
100 milliseconds |
10 Hz |
0 Hz |
10 Hz |
|
1 second |
1 Hz |
4 Hz |
5 Hz |
|
10 seconds |
0.1 Hz |
4.5 Hz |
4.5 Hz |
An important thing to notice is that fast scan rates show bigger spikes. Readings performed at scan rates faster than your frequency create very significant resolution errors. To reduce the errors to acceptable limits, average your readings.
How does this affect your wind gust readings?
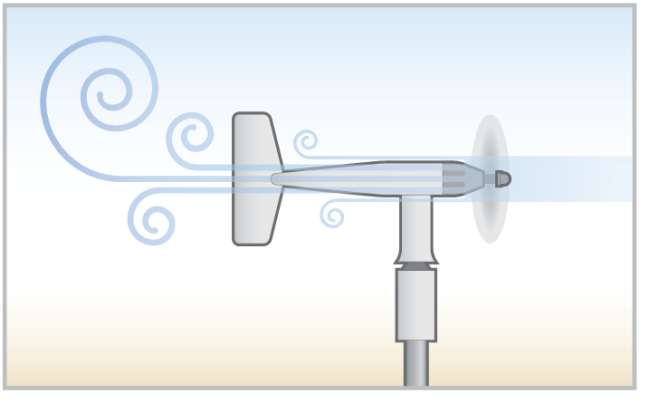
To explain the effect, I will use the 03101 Wind Sentry Anemometer as an example. This anemometer has a multiplier of 0.75 m/s per Hz. So, a 10 Hz resolution error creates an error of 7.5 m/s. If you were to directly use the raw readings from a 100-millisecond (10 Hz) scan, your maximum wind speed could be overreported by 7.5 m/s! That is a huge error if your actual wind speed didn't exceed 2 m/s.
Wind gust is often reported as a maximum three-second average wind speed. The same sensor on a three-second interval has a resolution of 0.25 m/s. So, if we use the AvgRun() instruction to get a three-second average before taking the maximum, the data logger might overreport by 0.25 m/s. That is 30 times smaller than the error we were seeing without averaging first.
What is the total accuracy of a pulse measurement?
The total measurement error of a pulse measurement done on a data logger is the clock error plus the resolution error. The resolution error, as we have seen, is 1 divided by the scan interval. The clock error on a CR1000X is 0.02%. That gives us the specified accuracy of ±(0.02% of reading + 1/scan).
On short time periods, the resolution error dominates. Long time intervals greatly reduce it. On a daily average, the resolution error will be only 1/86400 Hz.
Takeaway Message
With pulse measurements, there is a tradeoff between responsive data displays and resolution errors. On intervals counted in minutes, you probably won't notice the measurement errors. When you want a real-time data display, you need to carefully consider what time interval to use. If you have any questions about resolution or accuracy as they relate to pulse measurements, please post them below.
Click the graph for a larger image.


Acerca del autor
 Jacob Davis is the Director of Client Services and Support at Campbell Scientific, Inc. He works with the worldwide technical support teams. His specialties include serial communications and advanced data logger programming. Jacob has a master’s degree in hydrology and worked with large irrigation projects before coming to Campbell Scientific, Inc.
Comentarios
GAG | 02/01/2018 at 11:44 PM
Hi, Jacob,
I do not knowing this sentence mean "A 200.25 Hz signal would be offset but show the same oscillation on top of it.", can you give more informaion?
This article is great, thanks.
JDavis | 02/02/2018 at 08:11 AM
A 200.25Hz signal would show values between 200 and 201. The spikes would be shaped the same.
sd-sco | 10/29/2018 at 12:51 PM
Would this mean error is the same for a wind gust that that is the maximum of 100 3-second samples would have the same error as a wind gust that is the maximum of 300 3-second running averages made from 1-second samples?
JDavis | 10/29/2018 at 12:53 PM
The resolution of your wind gust will be based on that 3 second running average. Taking the maximum won't affect the resolution.
Please log in or register to comment.