VSPECT™ Essentials Patented technology to improve vibrating wire measurements
In this Section
Overview
Vibrating wire sensors are recognized as the optimal sensor for long-term deployments. Vibrating wire sensors offer true “return to zero,” unparalleled long-term stability, and uncompromised temperature correction. For this reason, Campbell Scientific data acquisition (DAQ) systems have been used for decades to monitor the output of vibrating wire sensors.
While vibrating wire sensors provide excellent measurements, there are still some challenges to overcome. Campbell Scientific engineers were approached years ago and asked if they could develop a device that could overcome the challenges inherent to these sensors. They identified four areas of concern:
- Understand when sensor readings begin to drift or go “bad.” The amplitude or frequency of a vibrating wire sensor can, over decades of deployment, degrade in the sensor. Using the traditional time-domain method of measurement can make it very difficult to get an accurate measurement.
- Measurements of vibrating wire sensors have variability in the results and usually require back-end data analysis to extract correct data. Engineers wanted to increase the fidelity of the measurement and increase the confidence that the data is correct directly from the sensor.
- Vibrating wire sensors are surrounded and influenced by electrical fields. Manually removing this electrical noise from the measured data takes time and resources. Engineers wanted a device that automatically removed the noise before it was recorded.
- Measure vibrating wire sensors accurately and repeatedly with excessively long cable lengths.
Campbell Scientific was able to address each of these areas of concern as they developed the spectral analysis approach to measuring vibrating wire sensors. This patented VSPECT™ technology has been incorporated into several Campbell Scientific measurement devices. Each provides:
- Measurement diagnostics that offers signal amplitude, signal-to-noise ratio, and competing noise frequency. This allows the continued use of the same sensor for decades even if the wire were to relax.
- Increased measurement precision. Sensors measured using VSPECT have 10 times greater measurement precision than traditional time-domain methods.
- Eliminated electrical noise. Post-processing to remove erroneous data is no longer required. This means the data can be used in real-time.
- Increased cable lengths. Capability to extend vibrating wire sensor cable lengths beyond what can be measured with the time-domain method.
For more information, watch the VSPECT—Understanding the Basics video below.
Introduction
Structural and geotechnical engineers often use vibrating wire sensors to measure strain, pressure, tilt, displacement, and load. These sensors have a reputation for being accurate, stable, and durable—making them well suited for long-term static monitoring. Despite their acceptance, vibrating wire sensors are sometimes plagued by a susceptibility to external electromagnetic noise and loosening, over time, of the vibrating wire within the sensor. This weakness can produce unusable data, requiring data analysts to devote considerable effort to qualifying their data. This susceptibility to external noise is especially difficult in real-time alarm systems where post-collection analysis is not possible. Post-collection analysis is also time consuming and expensive.
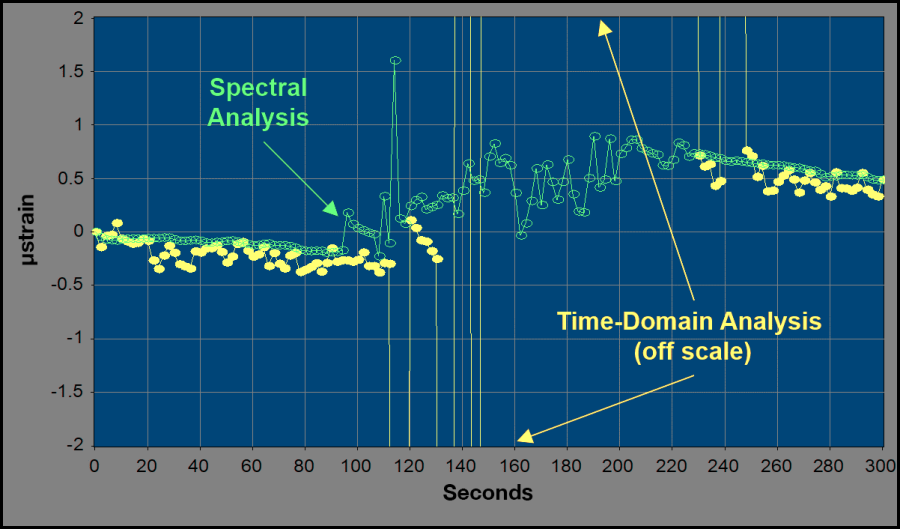
This web resource discusses a frequency-domain approach that uses spectral analysis to read vibrating wire sensors, which improves noise immunity, introduces additional diagnostics, and improves measurement precision when compared to traditional time-domain methods. Fig. 1 shows this improved noise immunity when a drill motor was used to simulate external noise interference near a vibrating wire strain gage.
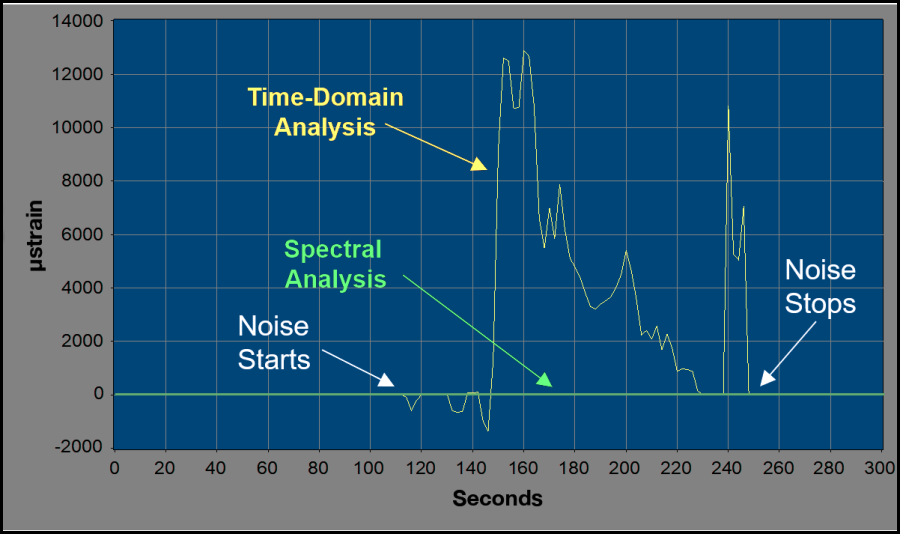
Although the actual strain changed by only a few tenths of a µstrain during the test, the time-domain analysis gave errors of 12,000 µstrain. As shown in Fig. 2, the spectral analysis gave errors of typically less than ±0.5 µstrain during the same noise event.